Measure Blood Pressure
Warning: This application note is for learning and development only. It is not for Medical Diagnostic Use.
This app note is provided AS-IS and no support is available. The user must have the pre-requisite knowledge of the software used.
A traditional sphygmomanometer consists of an inflatable cuff, a measuring unit (the mercury manometer, or aneroid gauge), and a mechanism for inflation which may be a manually operated bulb and valve or a pump operated electrically. The usual unit of measurement of blood pressure is millimeters of mercury (mmHg)

An electronic blood pressure meter replaces the mercury manometer with an electronic one using a pressure sensor. By adding the appropriate software a semi-automatic solution can be obtained. A fully automatic system can be achieved by further adding an electronically activated pump and valve.
Hardware
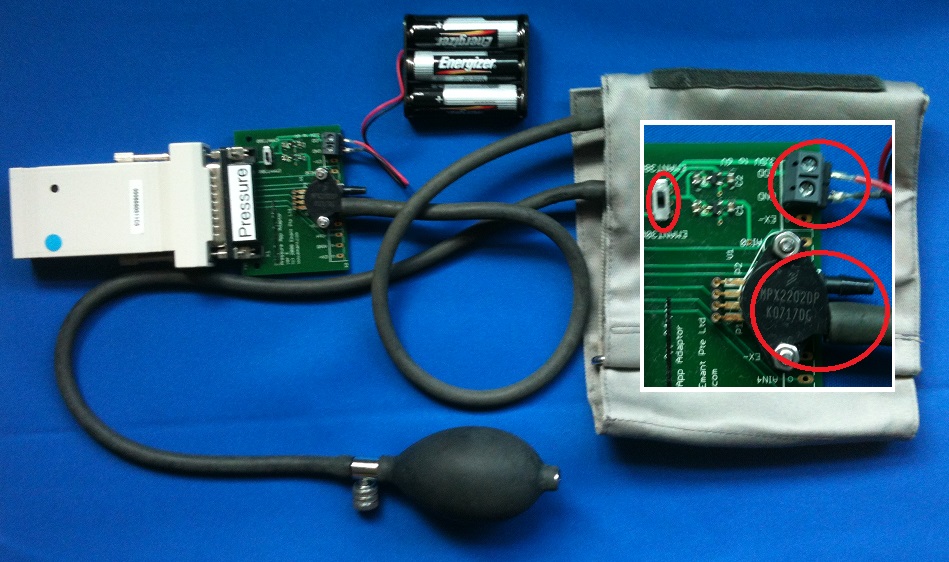
- EMANT380 Bluetooth DAQ module
- Pressure Application Adaptor
- Battery Holder
- Sphygmomanometer Velcro Cuff
- Bulb with Valve
Important Notes:
- Check that the power supply polarity is correct. Voltage supply is from 3.8V min to 6V max.
- Pressure Application Switch is in the EMANT380 position. When it is in the EMANT300 position, power is OFF.
- The correct port of the Pressure Sensor is connected
- Observe safety first when inflating the cuff.
Software
One of the following
- Python (PC, Android, Raspberry Pi)
- Visual C# (PC Windows only)
- LabVIEW (PC Windows only). Recommended only for LabVIEW users.
Measure Blood Pressure
There are 3 ways of measuring blood pressure electronically
- Manual
- Semi-Automatic
- Automatic
Manual sphygmomanometer
This method replaces the mercury manometer with an electronic one. For blood pressure measurements, the unit of measurement is mmHg instead of kPa. This method also requires a stethoscope for auscultation. It is used by trained practitioners.
With a manual instrument, listening with a stethoscope to the brachial artery at the elbow, the examiner slowly releases the pressure in the cuff. As the pressure in the cuffs falls, a "whooshing" or pounding sound is heard (see Korotkoff sounds) when blood flow first starts again in the artery. The pressure at which this sound began is noted and recorded as the systolic blood pressure. The cuff pressure is further released until the sound can no longer be heard. This is recorded as the diastolic blood pressure.
Semi-automatic blood pressure monitor
The oscillometric method measures the oscillations in the sphygmomanometer cuff pressure which are caused by the oscillations of blood flow, i.e., the pulse. The electronic version of this method uses a sphygmomanometer cuff with an electronic pressure sensor to observe cuff pressure oscillations and software to automatically interpret them.
The semi-automatic method uses the bulb and valve to manually inflate and deflate the cuff.
Oscillometric measurement requires less skill than the auscultatory technique and may be suitable for use by untrained staff and for automated patient home monitoring.
The cuff is inflated to a pressure initially in excess of the systolic arterial pressure and then reduced to below diastolic pressure over a period of about 30 seconds. When blood flow is nil (cuff pressure exceeding systolic pressure) or unimpeded (cuff pressure below diastolic pressure), cuff pressure will be essentially constant. It is essential that the cuff size is correct: undersized cuffs may yield too high a pressure; oversized cuffs yield too low a pressure. When blood flow is present, but restricted, the cuff pressure, which is monitored by the pressure sensor, will vary periodically in synchrony with the cyclic expansion and contraction of the brachial artery, i.e., it will oscillate. The values of systolic and diastolic pressure are computed, not actually measured from the raw data, using an algorithm and the computed results are displayed.
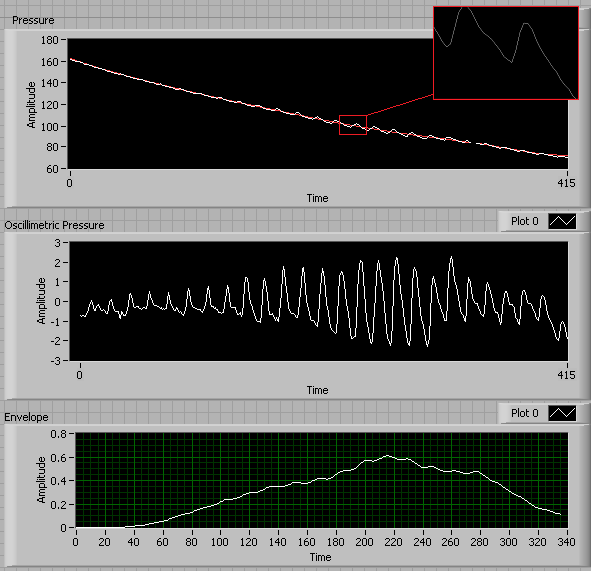
- The first graph shows the falling blood pressure when the cuff is deflated slowly. For the EMANT380, we recommend a sampling rate of 10Hz to 30Hz.
- The second graph is obtained by applying a low pass filter to the blood pressure measurement. This extracts the small oscillations at the cardiac frequency.
- The final graph results when the envelope of these oscillations is computed. This can be done by calculating the area obtained by integrating each pulse or measuring the peak of the oscillations.
The mean arterial pressure, systolic and diastolic pressure are then calculated using the final envelope waveform.
The oscillations in cuff pressure increase in amplitude as cuff pressure falls between systolic and mean arterial pressure. The oscillations then decrease in amplitude as cuff pressure falls below mean arterial pressure.
The point of maximal oscillations corresponds closely to mean arterial pressure. Points on the envelope corresponding to systolic and diastolic pressure, however, are less well established. Frequently a version of the maximum amplitude algorithm is used to estimate systolic and diastolic pressure values. The point of maximal oscillations is used to divide the envelope into rising and falling phases. Then characteristic ratios or fractions of the peak amplitude are used to find points corresponding to systolic pressure on the rising phase of the envelope and to diastolic pressure on the falling phase of the envelope.
The characteristic ratios (also known as oscillation ratios or systolic and diastolic detection ratios) have been obtained experimentally by measuring cuff oscillation amplitudes at independently determined systolic or diastolic points, divided by the maximum cuff oscillation amplitude. The systolic point is found at about 50% of the peak height on the rising phase of the envelope. The diastolic point is found at about 70 percent of the peak height on the falling phase of the envelope.
More information can be found in this paper Oscillometric measurement of systolic and diastolic blood pressures validated in a physiologic mathematical model
Full-automatic blood pressure monitor
The automatic method is similar to the semi-automatic one except that the fully automatic method uses an electronically activated pump and valve for automatic inflation and deflation of the cuff.
App note, schematic and LabVIEW example
References
First graph shows the fluctuations observed in an occluding cuff as the pressure is initially raised and then gradually dropped. The second graph shows the cardiac synchronous oscillations present in the cuff pressure which vary with the cuff pressure.
A new analysis of relevant anatomy, physiology and physics reveals the mechanisms underlying the production of cuff pressure oscillations as well as a way to extract systolic and diastolic pressures from the envelope of oscillations in any individual subject.